werk ships with an optional terminal dashboard that shows live queue depths, throughput, and worker activity.
Screenshots
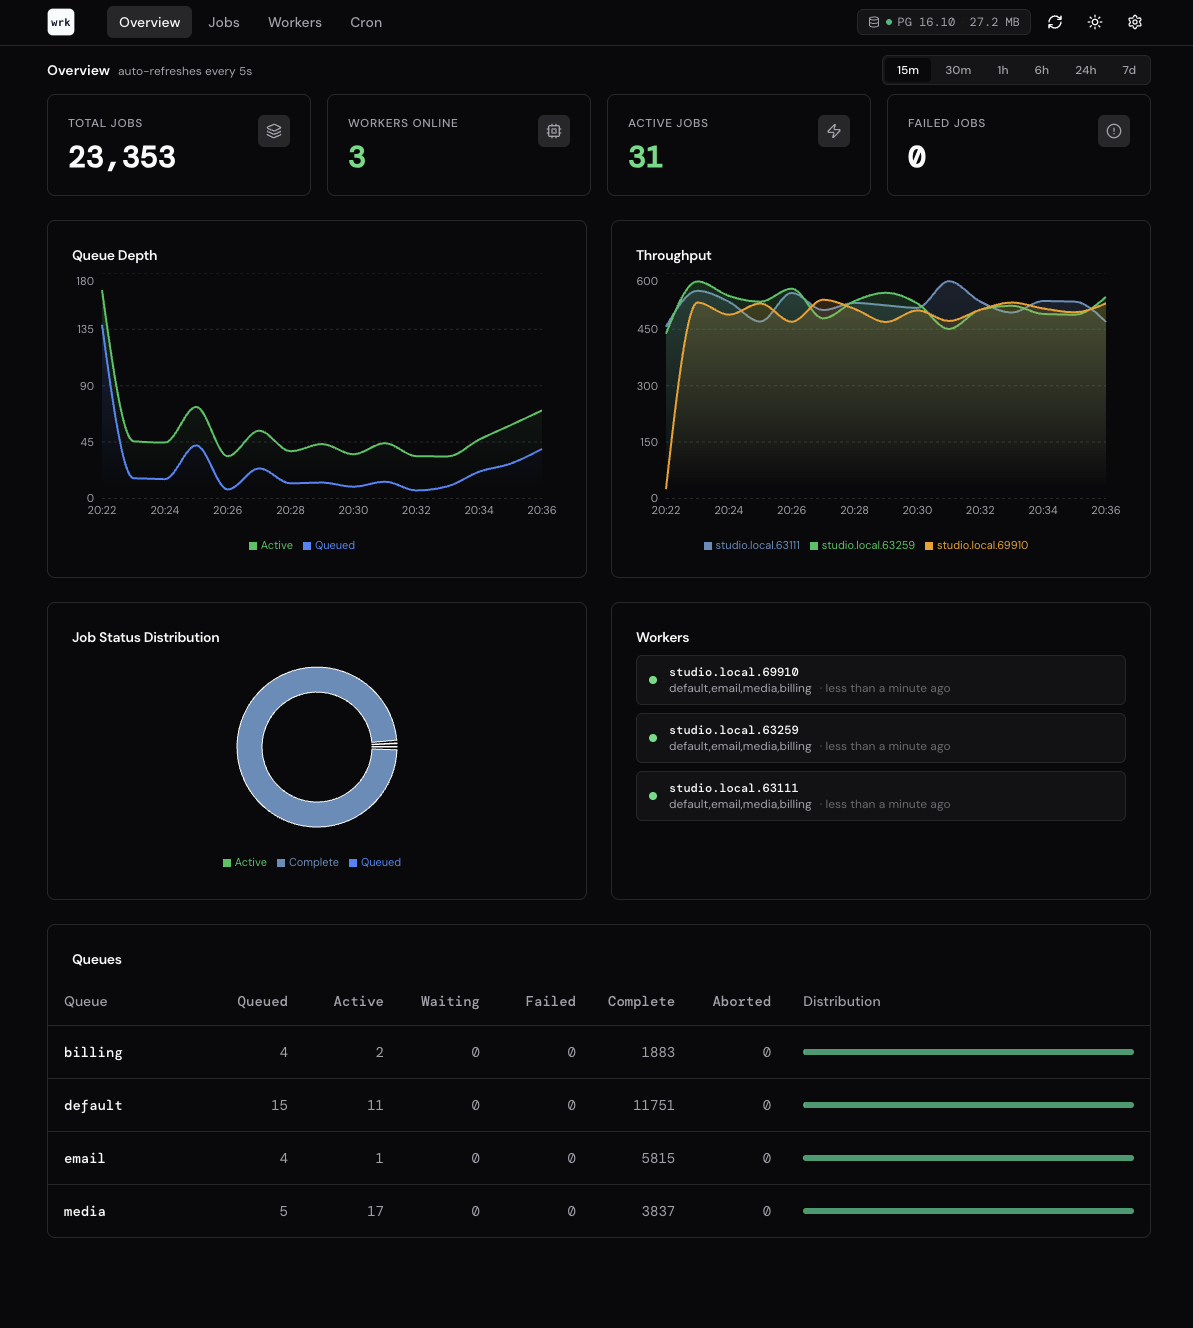
Overview
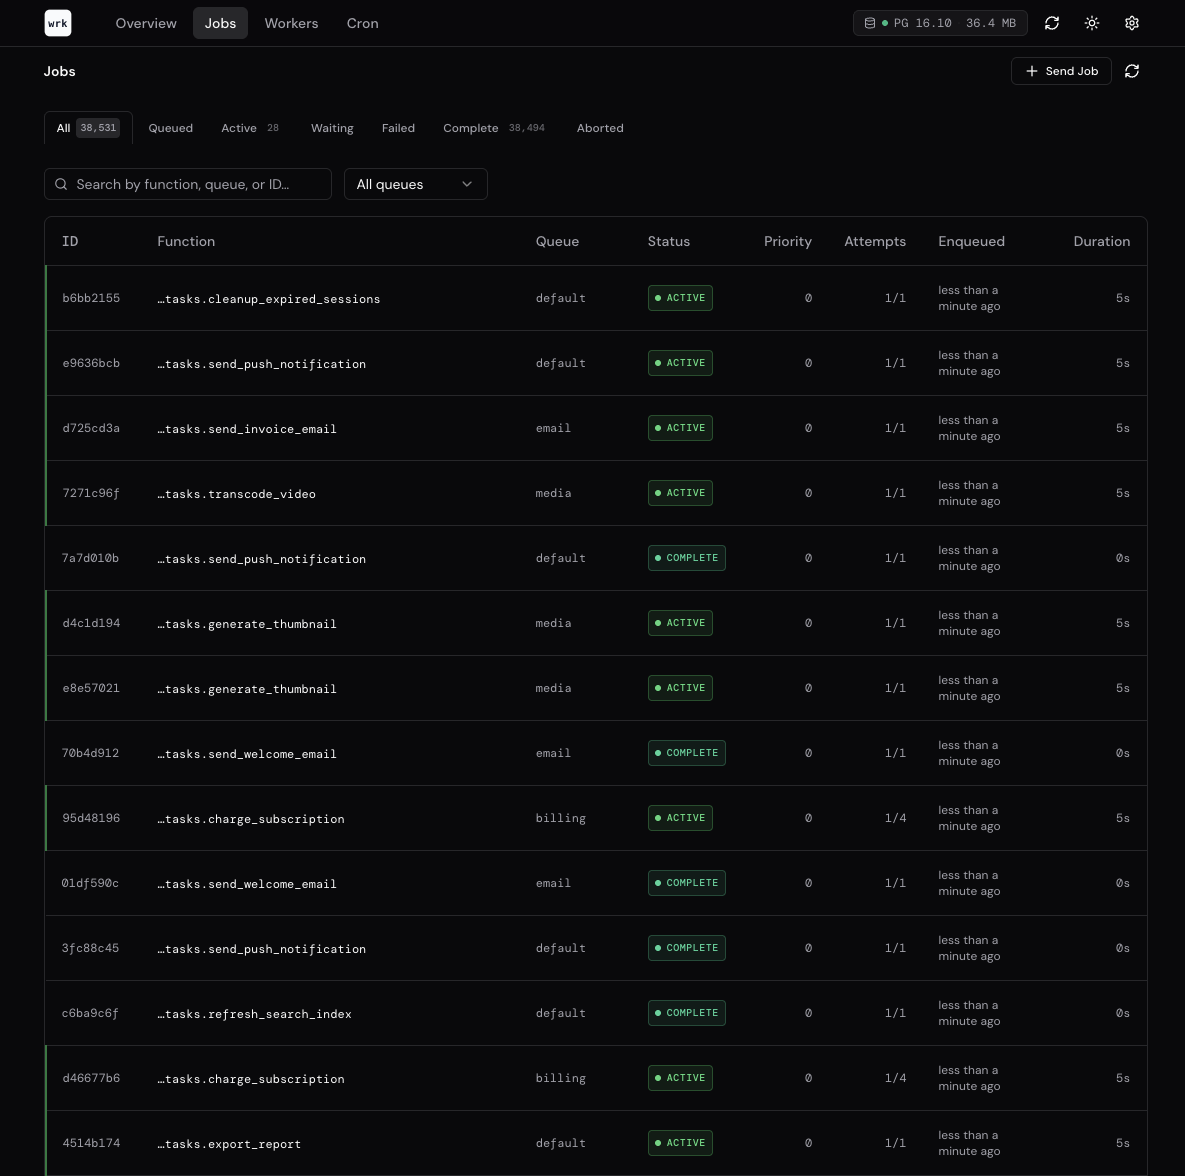
Jobs
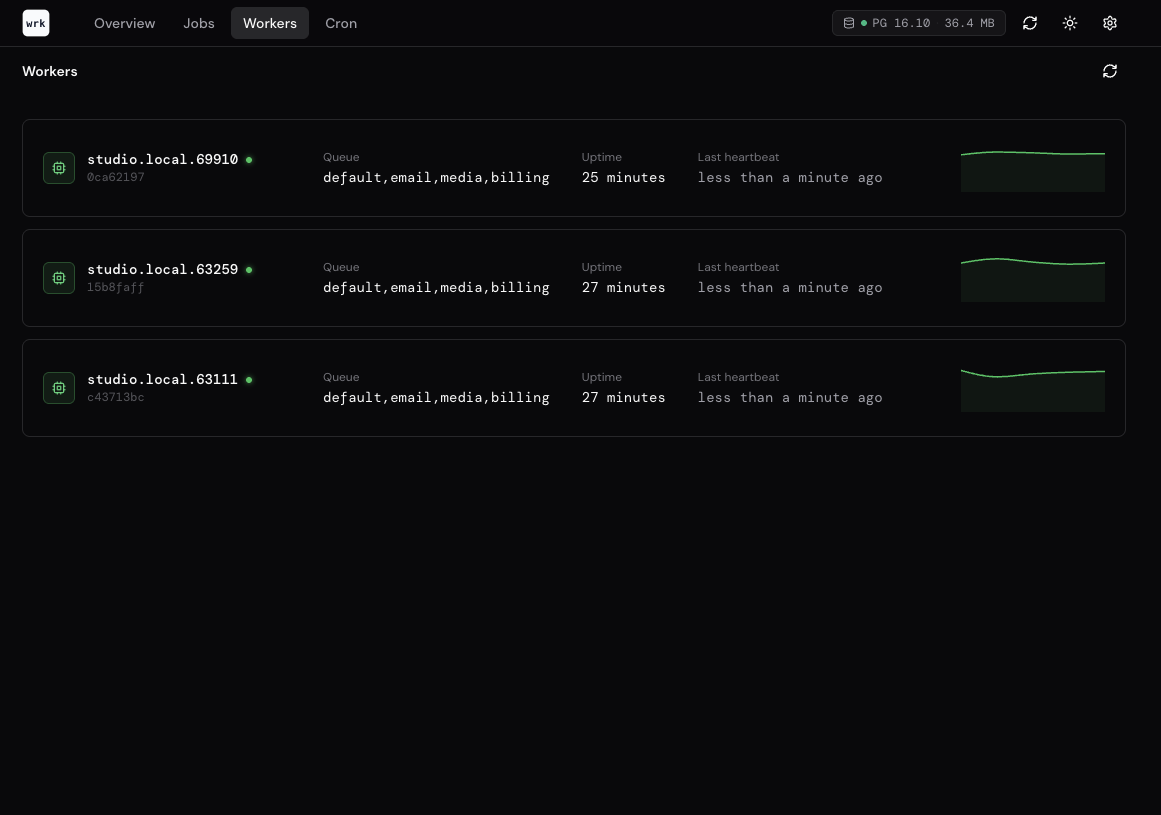
Workers
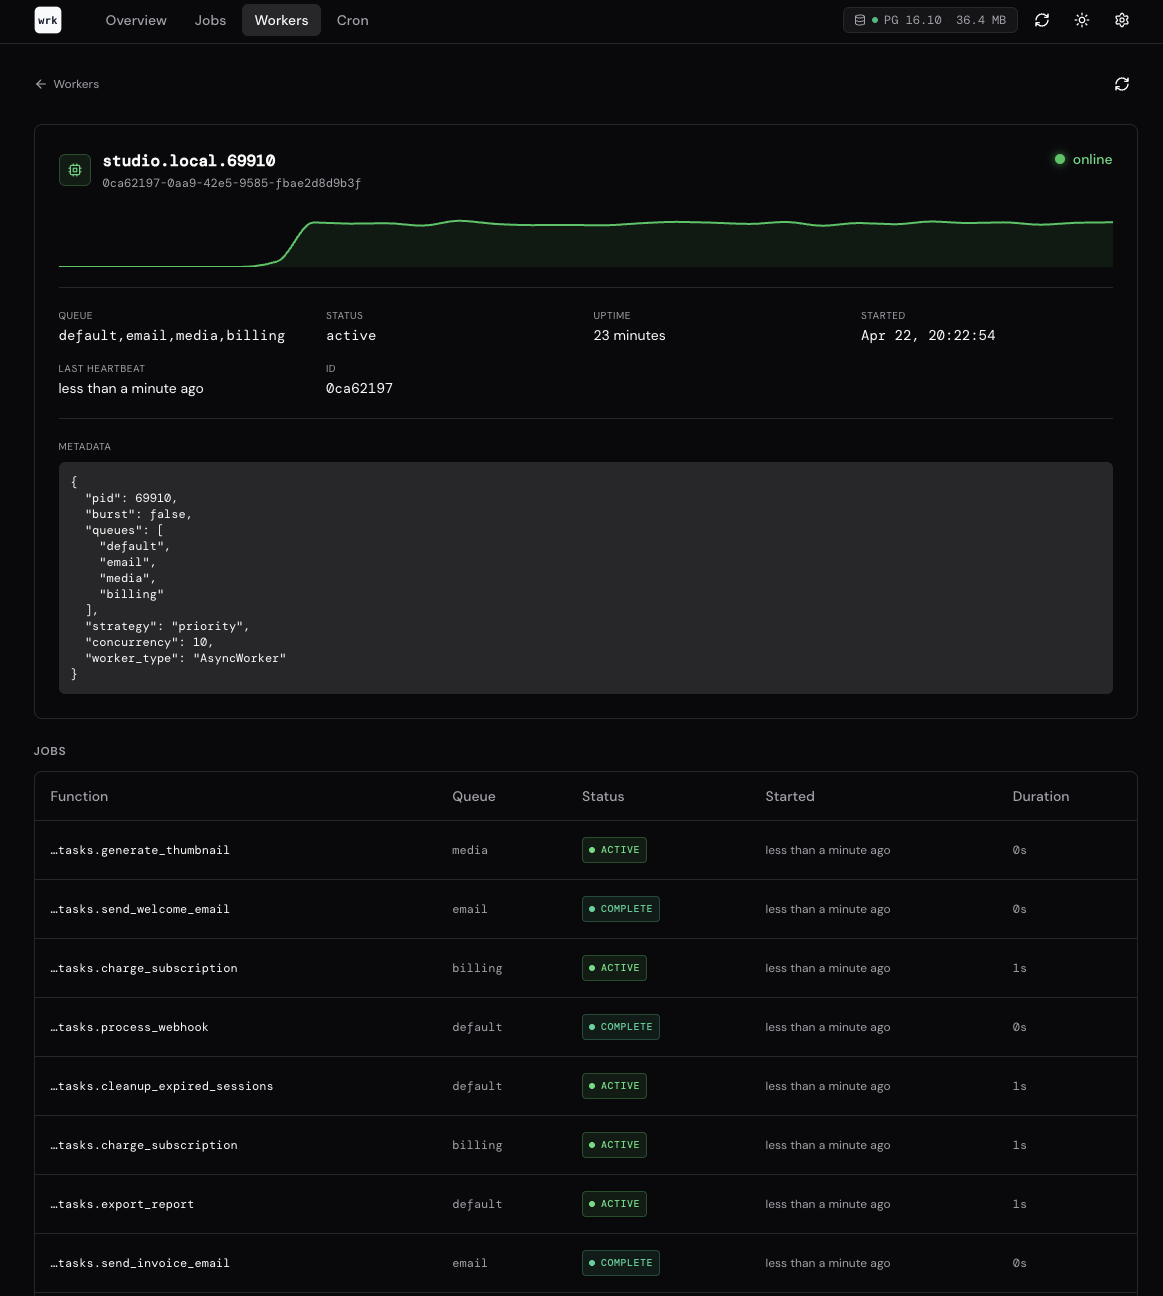
Worker details
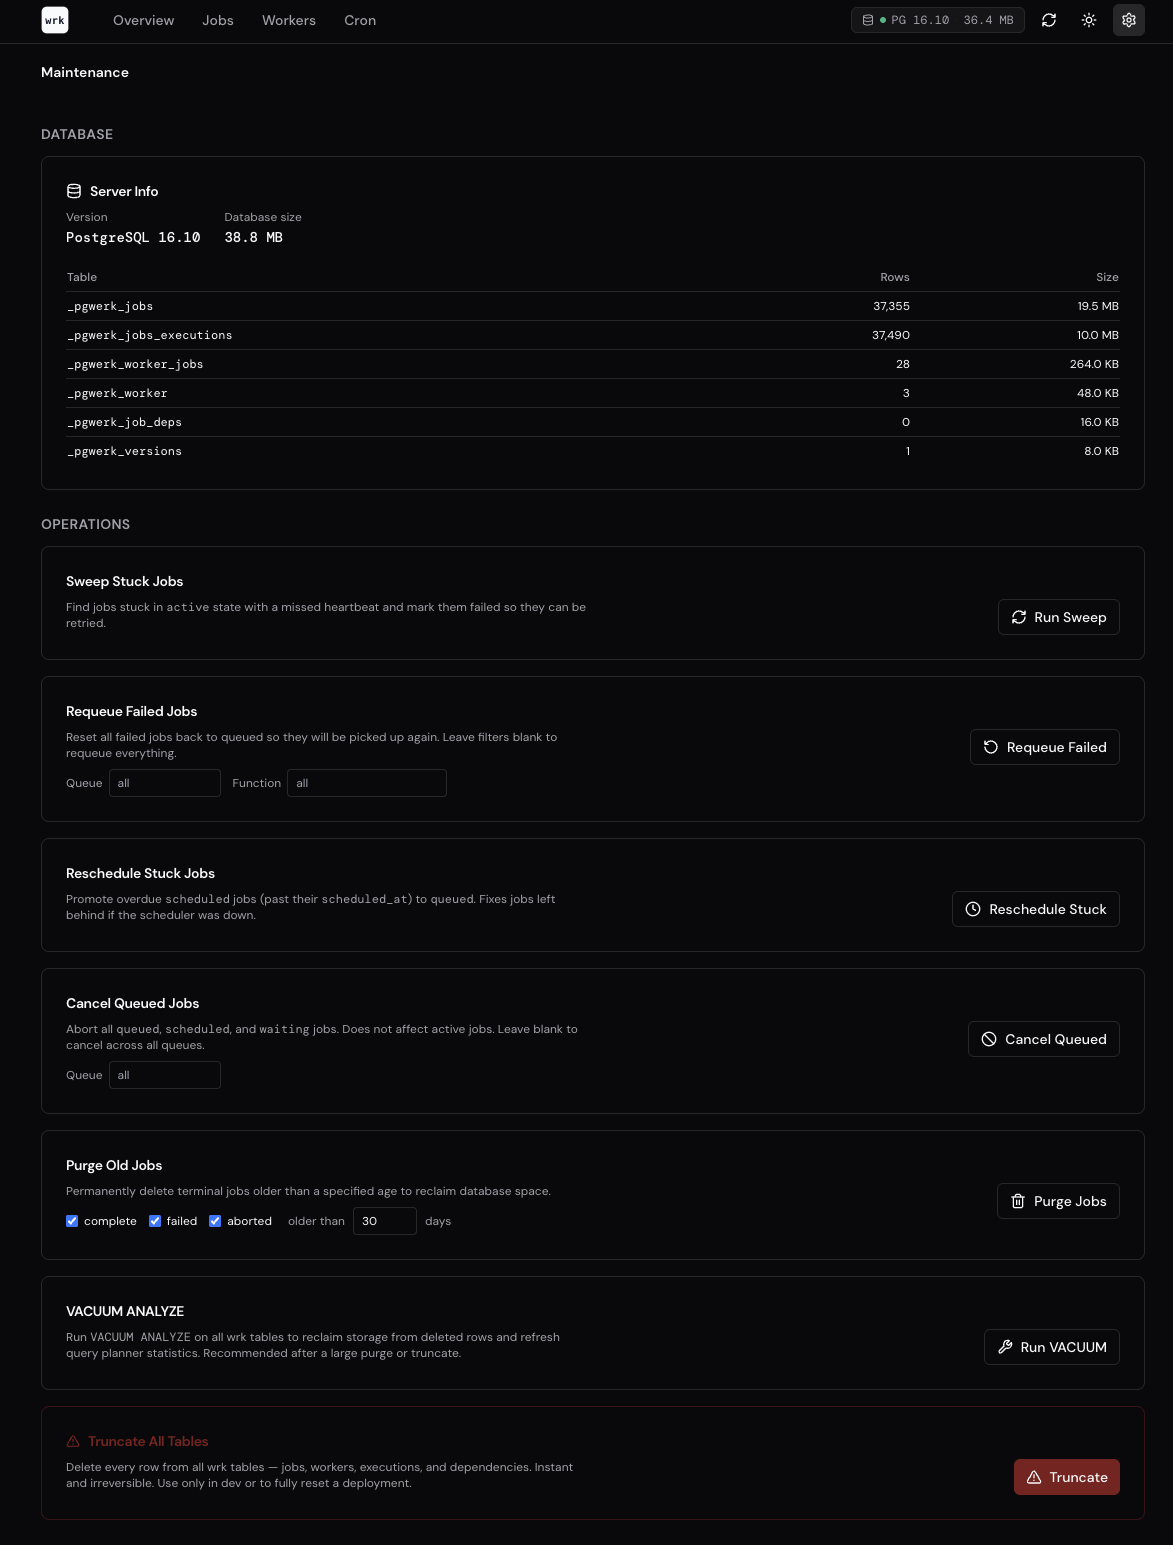
Maintenance
Install
The dashboard requires the analytics optional extra:
pip install "pgwerk[analytics]"
This installs rich and plotext as additional dependencies.
Start
Pass your Werk instance using the standard module:attribute format:
werk dashboard myapp.tasks:app
What it shows
The dashboard refreshes automatically and displays:
- Queue depth — pending job counts per queue
- Active workers — registered worker instances, their queues, and heartbeat status
- Throughput chart — completed jobs over the last N minutes
- Queue depth history — how queue depth has changed over time
- Server info — Postgres version, database size, table prefix
REST API
For programmatic access to queue and worker metrics, the optional REST API provides JSON endpoints:
pip install "pgwerk[api]"
werk api myapp.tasks:app
The API is built with Litestar and exposes endpoints for listing jobs, queue statistics, worker status, and job management (cancel, requeue, purge).